mirror of
https://github.com/Estom/notes.git
synced 2026-02-07 04:23:55 +08:00
2050 lines
59 KiB
Markdown
2050 lines
59 KiB
Markdown
# 烹饪指南
|
||
|
||
本节列出了一些**短小精悍**的 Pandas 实例与链接。
|
||
|
||
我们希望 Pandas 用户能积极踊跃地为本文档添加更多内容。为本节添加实用示例的链接或代码,是 Pandas 用户提交第一个 **Pull Request** 最好的选择。
|
||
|
||
本节列出了简单、精练、易上手的实例代码,以及 Stack Overflow 或 GitHub 上的链接,这些链接包含实例代码的更多详情。
|
||
|
||
`pd` 与 `np` 是 Pandas 与 Numpy 的缩写。为了让新手易于理解,其它模块是显式导入的。
|
||
|
||
下列实例均为 Python 3 代码,简单修改即可用于 Python 早期版本。
|
||
|
||
## 惯用语
|
||
|
||
以下是 Pandas 的`惯用语`。
|
||
|
||
[对一列数据执行 if-then / if-then-else 操作,把计算结果赋值给一列或多列:](https://stackoverflow.com/questions/17128302/python-pandas-idiom-for-if-then-else)
|
||
|
||
```python
|
||
In [1]: df = pd.DataFrame({'AAA': [4, 5, 6, 7],
|
||
...: 'BBB': [10, 20, 30, 40],
|
||
...: 'CCC': [100, 50, -30, -50]})
|
||
...:
|
||
|
||
In [2]: df
|
||
Out[2]:
|
||
AAA BBB CCC
|
||
0 4 10 100
|
||
1 5 20 50
|
||
2 6 30 -30
|
||
3 7 40 -50
|
||
```
|
||
|
||
### if-then…
|
||
|
||
在一列上执行 if-then 操作:
|
||
|
||
```python
|
||
In [3]: df.loc[df.AAA >= 5, 'BBB'] = -1
|
||
|
||
In [4]: df
|
||
Out[4]:
|
||
AAA BBB CCC
|
||
0 4 10 100
|
||
1 5 -1 50
|
||
2 6 -1 -30
|
||
3 7 -1 -50
|
||
```
|
||
|
||
在两列上执行 if-then 操作:
|
||
|
||
```python
|
||
In [5]: df.loc[df.AAA >= 5, ['BBB', 'CCC']] = 555
|
||
|
||
In [6]: df
|
||
Out[6]:
|
||
AAA BBB CCC
|
||
0 4 10 100
|
||
1 5 555 555
|
||
2 6 555 555
|
||
3 7 555 555
|
||
```
|
||
|
||
再添加一行代码,执行 -else 操作:
|
||
|
||
```python
|
||
In [7]: df.loc[df.AAA < 5, ['BBB', 'CCC']] = 2000
|
||
|
||
In [8]: df
|
||
Out[8]:
|
||
AAA BBB CCC
|
||
0 4 2000 2000
|
||
1 5 555 555
|
||
2 6 555 555
|
||
3 7 555 555
|
||
```
|
||
|
||
或用 Pandas 的 `where` 设置掩码(mask):
|
||
|
||
```python
|
||
In [9]: df_mask = pd.DataFrame({'AAA': [True] * 4,
|
||
...: 'BBB': [False] * 4,
|
||
...: 'CCC': [True, False] * 2})
|
||
...:
|
||
|
||
In [10]: df.where(df_mask, -1000)
|
||
Out[10]:
|
||
AAA BBB CCC
|
||
0 4 -1000 2000
|
||
1 5 -1000 -1000
|
||
2 6 -1000 555
|
||
3 7 -1000 -1000
|
||
```
|
||
|
||
[用 NumPy where() 函数实现 if-then-else](https://stackoverflow.com/questions/19913659/pandas-conditional-creation-of-a-series-dataframe-column)
|
||
|
||
```python
|
||
In [11]: df = pd.DataFrame({'AAA': [4, 5, 6, 7],
|
||
....: 'BBB': [10, 20, 30, 40],
|
||
....: 'CCC': [100, 50, -30, -50]})
|
||
....:
|
||
|
||
In [12]: df
|
||
Out[12]:
|
||
AAA BBB CCC
|
||
0 4 10 100
|
||
1 5 20 50
|
||
2 6 30 -30
|
||
3 7 40 -50
|
||
|
||
In [13]: df['logic'] = np.where(df['AAA'] > 5, 'high', 'low')
|
||
|
||
In [14]: df
|
||
Out[14]:
|
||
AAA BBB CCC logic
|
||
0 4 10 100 low
|
||
1 5 20 50 low
|
||
2 6 30 -30 high
|
||
3 7 40 -50 high
|
||
```
|
||
|
||
### 切割
|
||
|
||
[用布尔条件切割 DataFrame](https://stackoverflow.com/questions/14957116/how-to-split-a-dataframe-according-to-a-boolean-criterion)
|
||
|
||
```python
|
||
In [15]: df = pd.DataFrame({'AAA': [4, 5, 6, 7],
|
||
....: 'BBB': [10, 20, 30, 40],
|
||
....: 'CCC': [100, 50, -30, -50]})
|
||
....:
|
||
|
||
In [16]: df
|
||
Out[16]:
|
||
AAA BBB CCC
|
||
0 4 10 100
|
||
1 5 20 50
|
||
2 6 30 -30
|
||
3 7 40 -50
|
||
|
||
In [17]: df[df.AAA <= 5]
|
||
Out[17]:
|
||
AAA BBB CCC
|
||
0 4 10 100
|
||
1 5 20 50
|
||
|
||
In [18]: df[df.AAA > 5]
|
||
Out[18]:
|
||
AAA BBB CCC
|
||
2 6 30 -30
|
||
3 7 40 -50
|
||
```
|
||
|
||
### 设置条件
|
||
|
||
[多列条件选择](https://stackoverflow.com/questions/15315452/selecting-with-complex-criteria-from-pandas-dataframe)
|
||
|
||
```python
|
||
In [19]: df = pd.DataFrame({'AAA': [4, 5, 6, 7],
|
||
....: 'BBB': [10, 20, 30, 40],
|
||
....: 'CCC': [100, 50, -30, -50]})
|
||
....:
|
||
|
||
In [20]: df
|
||
Out[20]:
|
||
AAA BBB CCC
|
||
0 4 10 100
|
||
1 5 20 50
|
||
2 6 30 -30
|
||
3 7 40 -50
|
||
```
|
||
|
||
和(&),不赋值,直接返回 Series:
|
||
|
||
```python
|
||
In [21]: df.loc[(df['BBB'] < 25) & (df['CCC'] >= -40), 'AAA']
|
||
Out[21]:
|
||
0 4
|
||
1 5
|
||
Name: AAA, dtype: int64
|
||
```
|
||
|
||
或(|),不赋值,直接返回 Series:
|
||
|
||
```python
|
||
In [22]: df.loc[(df['BBB'] > 25) | (df['CCC'] >= -40), 'AAA']
|
||
Out[22]:
|
||
0 4
|
||
1 5
|
||
2 6
|
||
3 7
|
||
Name: AAA, dtype: int64
|
||
```
|
||
|
||
或(|),赋值,修改 DataFrame:
|
||
|
||
```python
|
||
In [23]: df.loc[(df['BBB'] > 25) | (df['CCC'] >= 75), 'AAA'] = 0.1
|
||
|
||
In [24]: df
|
||
Out[24]:
|
||
AAA BBB CCC
|
||
0 0.1 10 100
|
||
1 5.0 20 50
|
||
2 0.1 30 -30
|
||
3 0.1 40 -50
|
||
```
|
||
|
||
[用 argsort 选择最接近指定值的行](https://stackoverflow.com/questions/17758023/return-rows-in-a-dataframe-closest-to-a-user-defined-number)
|
||
|
||
```python
|
||
In [25]: df = pd.DataFrame({'AAA': [4, 5, 6, 7],
|
||
....: 'BBB': [10, 20, 30, 40],
|
||
....: 'CCC': [100, 50, -30, -50]})
|
||
....:
|
||
|
||
In [26]: df
|
||
Out[26]:
|
||
AAA BBB CCC
|
||
0 4 10 100
|
||
1 5 20 50
|
||
2 6 30 -30
|
||
3 7 40 -50
|
||
|
||
In [27]: aValue = 43.0
|
||
|
||
In [28]: df.loc[(df.CCC - aValue).abs().argsort()]
|
||
Out[28]:
|
||
AAA BBB CCC
|
||
1 5 20 50
|
||
0 4 10 100
|
||
2 6 30 -30
|
||
3 7 40 -50
|
||
```
|
||
|
||
[用二进制运算符动态减少条件列表](https://stackoverflow.com/questions/21058254/pandas-boolean-operation-in-a-python-list/21058331)
|
||
|
||
```python
|
||
In [29]: df = pd.DataFrame({'AAA': [4, 5, 6, 7],
|
||
....: 'BBB': [10, 20, 30, 40],
|
||
....: 'CCC': [100, 50, -30, -50]})
|
||
....:
|
||
|
||
In [30]: df
|
||
Out[30]:
|
||
AAA BBB CCC
|
||
0 4 10 100
|
||
1 5 20 50
|
||
2 6 30 -30
|
||
3 7 40 -50
|
||
|
||
In [31]: Crit1 = df.AAA <= 5.5
|
||
|
||
In [32]: Crit2 = df.BBB == 10.0
|
||
|
||
In [33]: Crit3 = df.CCC > -40.0
|
||
```
|
||
|
||
硬编码方式为:
|
||
|
||
```python
|
||
In [34]: AllCrit = Crit1 & Crit2 & Crit3
|
||
```
|
||
|
||
生成动态条件列表:
|
||
|
||
```python
|
||
In [35]: import functools
|
||
|
||
In [36]: CritList = [Crit1, Crit2, Crit3]
|
||
|
||
In [37]: AllCrit = functools.reduce(lambda x, y: x & y, CritList)
|
||
|
||
In [38]: df[AllCrit]
|
||
Out[38]:
|
||
AAA BBB CCC
|
||
0 4 10 100
|
||
```
|
||
|
||
## 选择
|
||
|
||
### DataFrames
|
||
|
||
更多信息,请参阅[索引](https://pandas.pydata.org/pandas-docs/stable/user_guide/indexing.html#indexing)文档。
|
||
|
||
[行标签与值作为条件](https://stackoverflow.com/questions/14725068/pandas-using-row-labels-in-boolean-indexing)
|
||
|
||
```python
|
||
In [39]: df = pd.DataFrame({'AAA': [4, 5, 6, 7],
|
||
....: 'BBB': [10, 20, 30, 40],
|
||
....: 'CCC': [100, 50, -30, -50]})
|
||
....:
|
||
|
||
In [40]: df
|
||
Out[40]:
|
||
AAA BBB CCC
|
||
0 4 10 100
|
||
1 5 20 50
|
||
2 6 30 -30
|
||
3 7 40 -50
|
||
|
||
In [41]: df[(df.AAA <= 6) & (df.index.isin([0, 2, 4]))]
|
||
Out[41]:
|
||
AAA BBB CCC
|
||
0 4 10 100
|
||
2 6 30 -30
|
||
```
|
||
|
||
[标签切片用 loc,位置切片用 iloc](https://github.com/pandas-dev/pandas/issues/2904)
|
||
|
||
```python
|
||
In [42]: df = pd.DataFrame({'AAA': [4, 5, 6, 7],
|
||
....: 'BBB': [10, 20, 30, 40],
|
||
....: 'CCC': [100, 50, -30, -50]},
|
||
....: index=['foo', 'bar', 'boo', 'kar'])
|
||
....:
|
||
```
|
||
|
||
前 2 个是显式切片方法,第 3 个是通用方法:
|
||
|
||
1. 位置切片,Python 切片风格,不包括结尾数据;
|
||
2. 标签切片,非 Python 切片风格,包括结尾数据;
|
||
3. 通用切片,支持两种切片风格,取决于切片用的是标签还是位置。
|
||
|
||
|
||
```python
|
||
In [43]: df.loc['bar':'kar'] # Label
|
||
Out[43]:
|
||
AAA BBB CCC
|
||
bar 5 20 50
|
||
boo 6 30 -30
|
||
kar 7 40 -50
|
||
|
||
# Generic
|
||
In [44]: df.iloc[0:3]
|
||
Out[44]:
|
||
AAA BBB CCC
|
||
foo 4 10 100
|
||
bar 5 20 50
|
||
boo 6 30 -30
|
||
|
||
In [45]: df.loc['bar':'kar']
|
||
Out[45]:
|
||
AAA BBB CCC
|
||
bar 5 20 50
|
||
boo 6 30 -30
|
||
kar 7 40 -50
|
||
```
|
||
|
||
包含整数,且不从 0 开始的索引,或不是逐步递增的索引会引发歧义。
|
||
|
||
```python
|
||
In [46]: data = {'AAA': [4, 5, 6, 7],
|
||
....: 'BBB': [10, 20, 30, 40],
|
||
....: 'CCC': [100, 50, -30, -50]}
|
||
....:
|
||
|
||
In [47]: df2 = pd.DataFrame(data=data, index=[1, 2, 3, 4]) # Note index starts at 1.
|
||
|
||
In [48]: df2.iloc[1:3] # Position-oriented
|
||
Out[48]:
|
||
AAA BBB CCC
|
||
2 5 20 50
|
||
3 6 30 -30
|
||
|
||
In [49]: df2.loc[1:3] # Label-oriented
|
||
Out[49]:
|
||
AAA BBB CCC
|
||
1 4 10 100
|
||
2 5 20 50
|
||
3 6 30 -30
|
||
```
|
||
|
||
[用逆运算符 (~)提取掩码的反向内容](https://stackoverflow.com/questions/14986510/picking-out-elements-based-on-complement-of-indices-in-python-pandas)
|
||
|
||
```python
|
||
In [50]: df = pd.DataFrame({'AAA': [4, 5, 6, 7],
|
||
....: 'BBB': [10, 20, 30, 40],
|
||
....: 'CCC': [100, 50, -30, -50]})
|
||
....:
|
||
|
||
In [51]: df
|
||
Out[51]:
|
||
AAA BBB CCC
|
||
0 4 10 100
|
||
1 5 20 50
|
||
2 6 30 -30
|
||
3 7 40 -50
|
||
|
||
In [52]: df[~((df.AAA <= 6) & (df.index.isin([0, 2, 4])))]
|
||
Out[52]:
|
||
AAA BBB CCC
|
||
1 5 20 50
|
||
3 7 40 -50
|
||
```
|
||
|
||
### 生成新列
|
||
|
||
[用 applymap 高效动态生成新列](https://stackoverflow.com/questions/16575868/efficiently-creating-additional-columns-in-a-pandas-dataframe-using-map)
|
||
|
||
```python
|
||
In [53]: df = pd.DataFrame({'AAA': [1, 2, 1, 3],
|
||
....: 'BBB': [1, 1, 2, 2],
|
||
....: 'CCC': [2, 1, 3, 1]})
|
||
....:
|
||
|
||
In [54]: df
|
||
Out[54]:
|
||
AAA BBB CCC
|
||
0 1 1 2
|
||
1 2 1 1
|
||
2 1 2 3
|
||
3 3 2 1
|
||
|
||
In [55]: source_cols = df.columns # Or some subset would work too
|
||
|
||
In [56]: new_cols = [str(x) + "_cat" for x in source_cols]
|
||
|
||
In [57]: categories = {1: 'Alpha', 2: 'Beta', 3: 'Charlie'}
|
||
|
||
In [58]: df[new_cols] = df[source_cols].applymap(categories.get)
|
||
|
||
In [59]: df
|
||
Out[59]:
|
||
AAA BBB CCC AAA_cat BBB_cat CCC_cat
|
||
0 1 1 2 Alpha Alpha Beta
|
||
1 2 1 1 Beta Alpha Alpha
|
||
2 1 2 3 Alpha Beta Charlie
|
||
3 3 2 1 Charlie Beta Alpha
|
||
```
|
||
|
||
[分组时用 min()](https://stackoverflow.com/questions/23394476/keep-other-columns-when-using-min-with-groupby)
|
||
|
||
```python
|
||
In [60]: df = pd.DataFrame({'AAA': [1, 1, 1, 2, 2, 2, 3, 3],
|
||
....: 'BBB': [2, 1, 3, 4, 5, 1, 2, 3]})
|
||
....:
|
||
|
||
In [61]: df
|
||
Out[61]:
|
||
AAA BBB
|
||
0 1 2
|
||
1 1 1
|
||
2 1 3
|
||
3 2 4
|
||
4 2 5
|
||
5 2 1
|
||
6 3 2
|
||
7 3 3
|
||
```
|
||
|
||
方法1:用 idxmin() 提取每组最小值的索引
|
||
|
||
```python
|
||
In [62]: df.loc[df.groupby("AAA")["BBB"].idxmin()]
|
||
Out[62]:
|
||
AAA BBB
|
||
1 1 1
|
||
5 2 1
|
||
6 3 2
|
||
```
|
||
|
||
方法 2:先排序,再提取每组的第一个值
|
||
|
||
```python
|
||
In [63]: df.sort_values(by="BBB").groupby("AAA", as_index=False).first()
|
||
Out[63]:
|
||
AAA BBB
|
||
0 1 1
|
||
1 2 1
|
||
2 3 2
|
||
```
|
||
|
||
注意,提取的数据一样,但索引不一样。
|
||
|
||
|
||
## 多层索引
|
||
|
||
更多信息,请参阅[多层索引](https://pandas.pydata.org/pandas-docs/stable/user_guide/advanced.html#advanced-hierarchical)文档。
|
||
|
||
[用带标签的字典创建多层索引](https://stackoverflow.com/questions/14916358/reshaping-dataframes-in-pandas-based-on-column-labels)
|
||
|
||
```python
|
||
In [64]: df = pd.DataFrame({'row': [0, 1, 2],
|
||
....: 'One_X': [1.1, 1.1, 1.1],
|
||
....: 'One_Y': [1.2, 1.2, 1.2],
|
||
....: 'Two_X': [1.11, 1.11, 1.11],
|
||
....: 'Two_Y': [1.22, 1.22, 1.22]})
|
||
....:
|
||
|
||
In [65]: df
|
||
Out[65]:
|
||
row One_X One_Y Two_X Two_Y
|
||
0 0 1.1 1.2 1.11 1.22
|
||
1 1 1.1 1.2 1.11 1.22
|
||
2 2 1.1 1.2 1.11 1.22
|
||
|
||
# 设置索引标签
|
||
In [66]: df = df.set_index('row')
|
||
|
||
In [67]: df
|
||
Out[67]:
|
||
One_X One_Y Two_X Two_Y
|
||
row
|
||
0 1.1 1.2 1.11 1.22
|
||
1 1.1 1.2 1.11 1.22
|
||
2 1.1 1.2 1.11 1.22
|
||
|
||
# 多层索引的列
|
||
In [68]: df.columns = pd.MultiIndex.from_tuples([tuple(c.split('_'))
|
||
....: for c in df.columns])
|
||
....:
|
||
|
||
In [69]: df
|
||
Out[69]:
|
||
One Two
|
||
X Y X Y
|
||
row
|
||
0 1.1 1.2 1.11 1.22
|
||
1 1.1 1.2 1.11 1.22
|
||
2 1.1 1.2 1.11 1.22
|
||
|
||
# 先 stack,然后 Reset 索引
|
||
|
||
In [70]: df = df.stack(0).reset_index(1)
|
||
|
||
In [71]: df
|
||
Out[71]:
|
||
level_1 X Y
|
||
row
|
||
0 One 1.10 1.20
|
||
0 Two 1.11 1.22
|
||
1 One 1.10 1.20
|
||
1 Two 1.11 1.22
|
||
2 One 1.10 1.20
|
||
2 Two 1.11 1.22
|
||
|
||
# 修整标签,注意自动添加了标签 `level_1`
|
||
In [72]: df.columns = ['Sample', 'All_X', 'All_Y']
|
||
|
||
In [73]: df
|
||
Out[73]:
|
||
Sample All_X All_Y
|
||
row
|
||
0 One 1.10 1.20
|
||
0 Two 1.11 1.22
|
||
1 One 1.10 1.20
|
||
1 Two 1.11 1.22
|
||
2 One 1.10 1.20
|
||
2 Two 1.11 1.22
|
||
```
|
||
|
||
### 运算
|
||
|
||
[多层索引运算要用广播机制](https://stackoverflow.com/questions/19501510/divide-entire-pandas-multiindex-dataframe-by-dataframe-variable/19502176#19502176)
|
||
|
||
```python
|
||
In [74]: cols = pd.MultiIndex.from_tuples([(x, y) for x in ['A', 'B', 'C']
|
||
....: for y in ['O', 'I']])
|
||
....:
|
||
|
||
In [75]: df = pd.DataFrame(np.random.randn(2, 6), index=['n', 'm'], columns=cols)
|
||
|
||
In [76]: df
|
||
Out[76]:
|
||
A B C
|
||
O I O I O I
|
||
n 0.469112 -0.282863 -1.509059 -1.135632 1.212112 -0.173215
|
||
m 0.119209 -1.044236 -0.861849 -2.104569 -0.494929 1.071804
|
||
|
||
In [77]: df = df.div(df['C'], level=1)
|
||
|
||
In [78]: df
|
||
Out[78]:
|
||
A B C
|
||
O I O I O I
|
||
n 0.387021 1.633022 -1.244983 6.556214 1.0 1.0
|
||
m -0.240860 -0.974279 1.741358 -1.963577 1.0 1.0
|
||
```
|
||
|
||
### 切片
|
||
|
||
[用 xs 切片多层索引](https://stackoverflow.com/questions/12590131/how-to-slice-multindex-columns-in-pandas-dataframes)
|
||
|
||
```python
|
||
In [79]: coords = [('AA', 'one'), ('AA', 'six'), ('BB', 'one'), ('BB', 'two'),
|
||
....: ('BB', 'six')]
|
||
....:
|
||
|
||
In [80]: index = pd.MultiIndex.from_tuples(coords)
|
||
|
||
In [81]: df = pd.DataFrame([11, 22, 33, 44, 55], index, ['MyData'])
|
||
|
||
In [82]: df
|
||
Out[82]:
|
||
MyData
|
||
AA one 11
|
||
six 22
|
||
BB one 33
|
||
two 44
|
||
six 55
|
||
```
|
||
|
||
提取第一层与索引第一个轴的交叉数据:
|
||
|
||
```python
|
||
# 注意:level 与 axis 是可选项,默认为 0
|
||
In [83]: df.xs('BB', level=0, axis=0)
|
||
Out[83]:
|
||
MyData
|
||
one 33
|
||
two 44
|
||
six 55
|
||
```
|
||
|
||
……现在是第 1 个轴的第 2 层
|
||
|
||
```python
|
||
In [84]: df.xs('six', level=1, axis=0)
|
||
Out[84]:
|
||
MyData
|
||
AA 22
|
||
BB 55
|
||
```
|
||
|
||
[用 xs 切片多层索引,方法 #2](https://stackoverflow.com/questions/14964493/multiindex-based-indexing-in-pandas)
|
||
|
||
```python
|
||
In [85]: import itertools
|
||
|
||
In [86]: index = list(itertools.product(['Ada', 'Quinn', 'Violet'],
|
||
....: ['Comp', 'Math', 'Sci']))
|
||
....:
|
||
|
||
In [87]: headr = list(itertools.product(['Exams', 'Labs'], ['I', 'II']))
|
||
|
||
In [88]: indx = pd.MultiIndex.from_tuples(index, names=['Student', 'Course'])
|
||
|
||
In [89]: cols = pd.MultiIndex.from_tuples(headr) # Notice these are un-named
|
||
|
||
In [90]: data = [[70 + x + y + (x * y) % 3 for x in range(4)] for y in range(9)]
|
||
|
||
In [91]: df = pd.DataFrame(data, indx, cols)
|
||
|
||
In [92]: df
|
||
Out[92]:
|
||
Exams Labs
|
||
I II I II
|
||
Student Course
|
||
Ada Comp 70 71 72 73
|
||
Math 71 73 75 74
|
||
Sci 72 75 75 75
|
||
Quinn Comp 73 74 75 76
|
||
Math 74 76 78 77
|
||
Sci 75 78 78 78
|
||
Violet Comp 76 77 78 79
|
||
Math 77 79 81 80
|
||
Sci 78 81 81 81
|
||
|
||
In [93]: All = slice(None)
|
||
|
||
In [94]: df.loc['Violet']
|
||
Out[94]:
|
||
Exams Labs
|
||
I II I II
|
||
Course
|
||
Comp 76 77 78 79
|
||
Math 77 79 81 80
|
||
Sci 78 81 81 81
|
||
|
||
In [95]: df.loc[(All, 'Math'), All]
|
||
Out[95]:
|
||
Exams Labs
|
||
I II I II
|
||
Student Course
|
||
Ada Math 71 73 75 74
|
||
Quinn Math 74 76 78 77
|
||
Violet Math 77 79 81 80
|
||
|
||
In [96]: df.loc[(slice('Ada', 'Quinn'), 'Math'), All]
|
||
Out[96]:
|
||
Exams Labs
|
||
I II I II
|
||
Student Course
|
||
Ada Math 71 73 75 74
|
||
Quinn Math 74 76 78 77
|
||
|
||
In [97]: df.loc[(All, 'Math'), ('Exams')]
|
||
Out[97]:
|
||
I II
|
||
Student Course
|
||
Ada Math 71 73
|
||
Quinn Math 74 76
|
||
Violet Math 77 79
|
||
|
||
In [98]: df.loc[(All, 'Math'), (All, 'II')]
|
||
Out[98]:
|
||
Exams Labs
|
||
II II
|
||
Student Course
|
||
Ada Math 73 74
|
||
Quinn Math 76 77
|
||
Violet Math 79 80
|
||
```
|
||
|
||
[用 xs 设置多层索引比例](https://stackoverflow.com/questions/19319432/pandas-selecting-a-lower-level-in-a-dataframe-to-do-a-ffill)
|
||
|
||
### 排序
|
||
|
||
[用多层索引按指定列或列序列表排序x](https://stackoverflow.com/questions/14733871/mutli-index-sorting-in-pandas)
|
||
|
||
```python
|
||
In [99]: df.sort_values(by=('Labs', 'II'), ascending=False)
|
||
Out[99]:
|
||
Exams Labs
|
||
I II I II
|
||
Student Course
|
||
Violet Sci 78 81 81 81
|
||
Math 77 79 81 80
|
||
Comp 76 77 78 79
|
||
Quinn Sci 75 78 78 78
|
||
Math 74 76 78 77
|
||
Comp 73 74 75 76
|
||
Ada Sci 72 75 75 75
|
||
Math 71 73 75 74
|
||
Comp 70 71 72 73
|
||
```
|
||
|
||
[部分选择,需要排序](https://github.com/pandas-dev/pandas/issues/2995)
|
||
|
||
### 层级
|
||
|
||
[为多层索引添加一层](http://stackoverflow.com/questions/14744068/prepend-a-level-to-a-pandas-multiindex)
|
||
|
||
[平铺结构化列](http://stackoverflow.com/questions/14507794/python-pandas-how-to-flatten-a-hierarchical-index-in-columns)
|
||
|
||
|
||
|
||
## 缺失数据
|
||
|
||
[缺失数据](https://pandas.pydata.org/pandas-docs/stable/user_guide/missing_data.html#missing-data) 文档。
|
||
|
||
向前填充逆序时间序列。
|
||
|
||
```python
|
||
In [100]: df = pd.DataFrame(np.random.randn(6, 1),
|
||
.....: index=pd.date_range('2013-08-01', periods=6, freq='B'),
|
||
.....: columns=list('A'))
|
||
.....:
|
||
|
||
In [101]: df.loc[df.index[3], 'A'] = np.nan
|
||
|
||
In [102]: df
|
||
Out[102]:
|
||
A
|
||
2013-08-01 0.721555
|
||
2013-08-02 -0.706771
|
||
2013-08-05 -1.039575
|
||
2013-08-06 NaN
|
||
2013-08-07 -0.424972
|
||
2013-08-08 0.567020
|
||
|
||
In [103]: df.reindex(df.index[::-1]).ffill()
|
||
Out[103]:
|
||
A
|
||
2013-08-08 0.567020
|
||
2013-08-07 -0.424972
|
||
2013-08-06 -0.424972
|
||
2013-08-05 -1.039575
|
||
2013-08-02 -0.706771
|
||
2013-08-01 0.721555
|
||
```
|
||
|
||
[空值时重置为 0,有值时累加](http://stackoverflow.com/questions/18196811/cumsum-reset-at-nan)
|
||
|
||
### 替换
|
||
|
||
[用反引用替换](http://stackoverflow.com/questions/16818871/extracting-value-and-creating-new-column-out-of-it)
|
||
|
||
## 分组
|
||
|
||
[分组](https://pandas.pydata.org/pandas-docs/stable/user_guide/groupby.html#groupby) 文档。
|
||
|
||
[用 apply 执行分组基础操作](http://stackoverflow.com/questions/15322632/python-pandas-df-groupy-agg-column-reference-in-agg)
|
||
|
||
与聚合不同,传递给 DataFrame 子集的 apply 可回调,可以访问所有列。
|
||
|
||
```python
|
||
In [104]: df = pd.DataFrame({'animal': 'cat dog cat fish dog cat cat'.split(),
|
||
.....: 'size': list('SSMMMLL'),
|
||
.....: 'weight': [8, 10, 11, 1, 20, 12, 12],
|
||
.....: 'adult': [False] * 5 + [True] * 2})
|
||
.....:
|
||
|
||
In [105]: df
|
||
Out[105]:
|
||
animal size weight adult
|
||
0 cat S 8 False
|
||
1 dog S 10 False
|
||
2 cat M 11 False
|
||
3 fish M 1 False
|
||
4 dog M 20 False
|
||
5 cat L 12 True
|
||
6 cat L 12 True
|
||
|
||
# 提取 size 列最重的动物列表
|
||
In [106]: df.groupby('animal').apply(lambda subf: subf['size'][subf['weight'].idxmax()])
|
||
Out[106]:
|
||
animal
|
||
cat L
|
||
dog M
|
||
fish M
|
||
dtype: object
|
||
```
|
||
|
||
[使用 get_group](http://stackoverflow.com/questions/14734533/how-to-access-pandas-groupby-dataframe-by-key)
|
||
|
||
```python
|
||
In [107]: gb = df.groupby(['animal'])
|
||
|
||
In [108]: gb.get_group('cat')
|
||
Out[108]:
|
||
animal size weight adult
|
||
0 cat S 8 False
|
||
2 cat M 11 False
|
||
5 cat L 12 True
|
||
6 cat L 12 True
|
||
```
|
||
|
||
[为同一分组的不同内容使用 Apply 函数](http://stackoverflow.com/questions/15262134/apply-different-functions-to-different-items-in-group-object-python-pandas)
|
||
|
||
```python
|
||
In [109]: def GrowUp(x):
|
||
.....: avg_weight = sum(x[x['size'] == 'S'].weight * 1.5)
|
||
.....: avg_weight += sum(x[x['size'] == 'M'].weight * 1.25)
|
||
.....: avg_weight += sum(x[x['size'] == 'L'].weight)
|
||
.....: avg_weight /= len(x)
|
||
.....: return pd.Series(['L', avg_weight, True],
|
||
.....: index=['size', 'weight', 'adult'])
|
||
.....:
|
||
|
||
In [110]: expected_df = gb.apply(GrowUp)
|
||
|
||
In [111]: expected_df
|
||
Out[111]:
|
||
size weight adult
|
||
animal
|
||
cat L 12.4375 True
|
||
dog L 20.0000 True
|
||
fish L 1.2500 True
|
||
```
|
||
|
||
[Apply 函数扩展](http://stackoverflow.com/questions/14542145/reductions-down-a-column-in-pandas)
|
||
|
||
```python
|
||
In [112]: S = pd.Series([i / 100.0 for i in range(1, 11)])
|
||
|
||
In [113]: def cum_ret(x, y):
|
||
.....: return x * (1 + y)
|
||
.....:
|
||
|
||
In [114]: def red(x):
|
||
.....: return functools.reduce(cum_ret, x, 1.0)
|
||
.....:
|
||
|
||
In [115]: S.expanding().apply(red, raw=True)
|
||
Out[115]:
|
||
0 1.010000
|
||
1 1.030200
|
||
2 1.061106
|
||
3 1.103550
|
||
4 1.158728
|
||
5 1.228251
|
||
6 1.314229
|
||
7 1.419367
|
||
8 1.547110
|
||
9 1.701821
|
||
dtype: float64
|
||
```
|
||
|
||
[用分组里的剩余值的平均值进行替换](http://stackoverflow.com/questions/14760757/replacing-values-with-groupby-means)
|
||
|
||
```python
|
||
In [116]: df = pd.DataFrame({'A': [1, 1, 2, 2], 'B': [1, -1, 1, 2]})
|
||
|
||
In [117]: gb = df.groupby('A')
|
||
|
||
In [118]: def replace(g):
|
||
.....: mask = g < 0
|
||
.....: return g.where(mask, g[~mask].mean())
|
||
.....:
|
||
|
||
In [119]: gb.transform(replace)
|
||
Out[119]:
|
||
B
|
||
0 1.0
|
||
1 -1.0
|
||
2 1.5
|
||
3 1.5
|
||
```
|
||
|
||
[按聚合数据排序](http://stackoverflow.com/questions/14941366/pandas-sort-by-group-aggregate-and-column)
|
||
|
||
```python
|
||
In [120]: df = pd.DataFrame({'code': ['foo', 'bar', 'baz'] * 2,
|
||
.....: 'data': [0.16, -0.21, 0.33, 0.45, -0.59, 0.62],
|
||
.....: 'flag': [False, True] * 3})
|
||
.....:
|
||
|
||
In [121]: code_groups = df.groupby('code')
|
||
|
||
In [122]: agg_n_sort_order = code_groups[['data']].transform(sum).sort_values(by='data')
|
||
|
||
In [123]: sorted_df = df.loc[agg_n_sort_order.index]
|
||
|
||
In [124]: sorted_df
|
||
Out[124]:
|
||
code data flag
|
||
1 bar -0.21 True
|
||
4 bar -0.59 False
|
||
0 foo 0.16 False
|
||
3 foo 0.45 True
|
||
2 baz 0.33 False
|
||
5 baz 0.62 True
|
||
```
|
||
|
||
[创建多个聚合列](http://stackoverflow.com/questions/14897100/create-multiple-columns-in-pandas-aggregation-function)
|
||
|
||
```python
|
||
In [125]: rng = pd.date_range(start="2014-10-07", periods=10, freq='2min')
|
||
|
||
In [126]: ts = pd.Series(data=list(range(10)), index=rng)
|
||
|
||
In [127]: def MyCust(x):
|
||
.....: if len(x) > 2:
|
||
.....: return x[1] * 1.234
|
||
.....: return pd.NaT
|
||
.....:
|
||
|
||
In [128]: mhc = {'Mean': np.mean, 'Max': np.max, 'Custom': MyCust}
|
||
|
||
In [129]: ts.resample("5min").apply(mhc)
|
||
Out[129]:
|
||
Mean 2014-10-07 00:00:00 1
|
||
2014-10-07 00:05:00 3.5
|
||
2014-10-07 00:10:00 6
|
||
2014-10-07 00:15:00 8.5
|
||
Max 2014-10-07 00:00:00 2
|
||
2014-10-07 00:05:00 4
|
||
2014-10-07 00:10:00 7
|
||
2014-10-07 00:15:00 9
|
||
Custom 2014-10-07 00:00:00 1.234
|
||
2014-10-07 00:05:00 NaT
|
||
2014-10-07 00:10:00 7.404
|
||
2014-10-07 00:15:00 NaT
|
||
dtype: object
|
||
|
||
In [130]: ts
|
||
Out[130]:
|
||
2014-10-07 00:00:00 0
|
||
2014-10-07 00:02:00 1
|
||
2014-10-07 00:04:00 2
|
||
2014-10-07 00:06:00 3
|
||
2014-10-07 00:08:00 4
|
||
2014-10-07 00:10:00 5
|
||
2014-10-07 00:12:00 6
|
||
2014-10-07 00:14:00 7
|
||
2014-10-07 00:16:00 8
|
||
2014-10-07 00:18:00 9
|
||
Freq: 2T, dtype: int64
|
||
```
|
||
|
||
[为 DataFrame 创建值计数列](http://stackoverflow.com/questions/17709270/i-want-to-create-a-column-of-value-counts-in-my-pandas-dataframe)
|
||
|
||
```python
|
||
In [131]: df = pd.DataFrame({'Color': 'Red Red Red Blue'.split(),
|
||
.....: 'Value': [100, 150, 50, 50]})
|
||
.....:
|
||
|
||
In [132]: df
|
||
Out[132]:
|
||
Color Value
|
||
0 Red 100
|
||
1 Red 150
|
||
2 Red 50
|
||
3 Blue 50
|
||
|
||
In [133]: df['Counts'] = df.groupby(['Color']).transform(len)
|
||
|
||
In [134]: df
|
||
Out[134]:
|
||
Color Value Counts
|
||
0 Red 100 3
|
||
1 Red 150 3
|
||
2 Red 50 3
|
||
3 Blue 50 1
|
||
```
|
||
|
||
[基于索引唯一某列不同分组的值](http://stackoverflow.com/q/23198053/190597)
|
||
|
||
```python
|
||
In [135]: df = pd.DataFrame({'line_race': [10, 10, 8, 10, 10, 8],
|
||
.....: 'beyer': [99, 102, 103, 103, 88, 100]},
|
||
.....: index=['Last Gunfighter', 'Last Gunfighter',
|
||
.....: 'Last Gunfighter', 'Paynter', 'Paynter',
|
||
.....: 'Paynter'])
|
||
.....:
|
||
|
||
In [136]: df
|
||
Out[136]:
|
||
line_race beyer
|
||
Last Gunfighter 10 99
|
||
Last Gunfighter 10 102
|
||
Last Gunfighter 8 103
|
||
Paynter 10 103
|
||
Paynter 10 88
|
||
Paynter 8 100
|
||
|
||
In [137]: df['beyer_shifted'] = df.groupby(level=0)['beyer'].shift(1)
|
||
|
||
In [138]: df
|
||
Out[138]:
|
||
line_race beyer beyer_shifted
|
||
Last Gunfighter 10 99 NaN
|
||
Last Gunfighter 10 102 99.0
|
||
Last Gunfighter 8 103 102.0
|
||
Paynter 10 103 NaN
|
||
Paynter 10 88 103.0
|
||
Paynter 8 100 88.0
|
||
```
|
||
|
||
[选择每组最大值的行](http://stackoverflow.com/q/26701849/190597)
|
||
|
||
```python
|
||
In [139]: df = pd.DataFrame({'host': ['other', 'other', 'that', 'this', 'this'],
|
||
.....: 'service': ['mail', 'web', 'mail', 'mail', 'web'],
|
||
.....: 'no': [1, 2, 1, 2, 1]}).set_index(['host', 'service'])
|
||
.....:
|
||
|
||
In [140]: mask = df.groupby(level=0).agg('idxmax')
|
||
|
||
In [141]: df_count = df.loc[mask['no']].reset_index()
|
||
|
||
In [142]: df_count
|
||
Out[142]:
|
||
host service no
|
||
0 other web 2
|
||
1 that mail 1
|
||
2 this mail 2
|
||
```
|
||
|
||
[Python itertools.groupby 式分组](http://stackoverflow.com/q/29142487/846892)
|
||
|
||
```python
|
||
In [143]: df = pd.DataFrame([0, 1, 0, 1, 1, 1, 0, 1, 1], columns=['A'])
|
||
|
||
In [144]: df.A.groupby((df.A != df.A.shift()).cumsum()).groups
|
||
Out[144]:
|
||
{1: Int64Index([0], dtype='int64'),
|
||
2: Int64Index([1], dtype='int64'),
|
||
3: Int64Index([2], dtype='int64'),
|
||
4: Int64Index([3, 4, 5], dtype='int64'),
|
||
5: Int64Index([6], dtype='int64'),
|
||
6: Int64Index([7, 8], dtype='int64')}
|
||
|
||
In [145]: df.A.groupby((df.A != df.A.shift()).cumsum()).cumsum()
|
||
Out[145]:
|
||
0 0
|
||
1 1
|
||
2 0
|
||
3 1
|
||
4 2
|
||
5 3
|
||
6 0
|
||
7 1
|
||
8 2
|
||
Name: A, dtype: int64
|
||
```
|
||
|
||
### 扩展数据
|
||
|
||
[Alignment and to-date](http://stackoverflow.com/questions/15489011/python-time-series-alignment-and-to-date-functions)
|
||
|
||
[基于计数值进行移动窗口计算](http://stackoverflow.com/questions/14300768/pandas-rolling-computation-with-window-based-on-values-instead-of-counts)
|
||
|
||
[按时间间隔计算滚动平均](http://stackoverflow.com/questions/15771472/pandas-rolling-mean-by-time-interval)
|
||
|
||
### 分割
|
||
|
||
[分割 DataFrame](http://stackoverflow.com/questions/13353233/best-way-to-split-a-dataframe-given-an-edge/15449992#15449992)
|
||
|
||
按指定逻辑,将不同的行,分割成 DataFrame 列表。
|
||
|
||
```python
|
||
In [146]: df = pd.DataFrame(data={'Case': ['A', 'A', 'A', 'B', 'A', 'A', 'B', 'A',
|
||
.....: 'A'],
|
||
.....: 'Data': np.random.randn(9)})
|
||
.....:
|
||
|
||
In [147]: dfs = list(zip(*df.groupby((1 * (df['Case'] == 'B')).cumsum()
|
||
.....: .rolling(window=3, min_periods=1).median())))[-1]
|
||
.....:
|
||
|
||
In [148]: dfs[0]
|
||
Out[148]:
|
||
Case Data
|
||
0 A 0.276232
|
||
1 A -1.087401
|
||
2 A -0.673690
|
||
3 B 0.113648
|
||
|
||
In [149]: dfs[1]
|
||
Out[149]:
|
||
Case Data
|
||
4 A -1.478427
|
||
5 A 0.524988
|
||
6 B 0.404705
|
||
|
||
In [150]: dfs[2]
|
||
Out[150]:
|
||
Case Data
|
||
7 A 0.577046
|
||
8 A -1.715002
|
||
```
|
||
|
||
|
||
### 透视表
|
||
|
||
[透视表](https://pandas.pydata.org/pandas-docs/stable/user_guide/reshaping.html#reshaping-pivot) 文档。
|
||
|
||
[部分汇总与小计](http://stackoverflow.com/questions/15570099/pandas-pivot-tables-row-subtotals/15574875#15574875)
|
||
|
||
```python
|
||
In [151]: df = pd.DataFrame(data={'Province': ['ON', 'QC', 'BC', 'AL', 'AL', 'MN', 'ON'],
|
||
.....: 'City': ['Toronto', 'Montreal', 'Vancouver',
|
||
.....: 'Calgary', 'Edmonton', 'Winnipeg',
|
||
.....: 'Windsor'],
|
||
.....: 'Sales': [13, 6, 16, 8, 4, 3, 1]})
|
||
.....:
|
||
|
||
In [152]: table = pd.pivot_table(df, values=['Sales'], index=['Province'],
|
||
.....: columns=['City'], aggfunc=np.sum, margins=True)
|
||
.....:
|
||
|
||
In [153]: table.stack('City')
|
||
Out[153]:
|
||
Sales
|
||
Province City
|
||
AL All 12.0
|
||
Calgary 8.0
|
||
Edmonton 4.0
|
||
BC All 16.0
|
||
Vancouver 16.0
|
||
... ...
|
||
All Montreal 6.0
|
||
Toronto 13.0
|
||
Vancouver 16.0
|
||
Windsor 1.0
|
||
Winnipeg 3.0
|
||
|
||
[20 rows x 1 columns]
|
||
```
|
||
|
||
[类似 R 的 plyr 频率表](http://stackoverflow.com/questions/15589354/frequency-tables-in-pandas-like-plyr-in-r)
|
||
|
||
```python
|
||
In [154]: grades = [48, 99, 75, 80, 42, 80, 72, 68, 36, 78]
|
||
|
||
In [155]: df = pd.DataFrame({'ID': ["x%d" % r for r in range(10)],
|
||
.....: 'Gender': ['F', 'M', 'F', 'M', 'F',
|
||
.....: 'M', 'F', 'M', 'M', 'M'],
|
||
.....: 'ExamYear': ['2007', '2007', '2007', '2008', '2008',
|
||
.....: '2008', '2008', '2009', '2009', '2009'],
|
||
.....: 'Class': ['algebra', 'stats', 'bio', 'algebra',
|
||
.....: 'algebra', 'stats', 'stats', 'algebra',
|
||
.....: 'bio', 'bio'],
|
||
.....: 'Participated': ['yes', 'yes', 'yes', 'yes', 'no',
|
||
.....: 'yes', 'yes', 'yes', 'yes', 'yes'],
|
||
.....: 'Passed': ['yes' if x > 50 else 'no' for x in grades],
|
||
.....: 'Employed': [True, True, True, False,
|
||
.....: False, False, False, True, True, False],
|
||
.....: 'Grade': grades})
|
||
.....:
|
||
|
||
In [156]: df.groupby('ExamYear').agg({'Participated': lambda x: x.value_counts()['yes'],
|
||
.....: 'Passed': lambda x: sum(x == 'yes'),
|
||
.....: 'Employed': lambda x: sum(x),
|
||
.....: 'Grade': lambda x: sum(x) / len(x)})
|
||
.....:
|
||
Out[156]:
|
||
Participated Passed Employed Grade
|
||
ExamYear
|
||
2007 3 2 3 74.000000
|
||
2008 3 3 0 68.500000
|
||
2009 3 2 2 60.666667
|
||
```
|
||
|
||
[按年生成 DataFrame](http://stackoverflow.com/questions/30379789/plot-pandas-data-frame-with-year-over-year-data)
|
||
|
||
跨列表创建年月:
|
||
|
||
```python
|
||
In [157]: df = pd.DataFrame({'value': np.random.randn(36)},
|
||
.....: index=pd.date_range('2011-01-01', freq='M', periods=36))
|
||
.....:
|
||
|
||
In [158]: pd.pivot_table(df, index=df.index.month, columns=df.index.year,
|
||
.....: values='value', aggfunc='sum')
|
||
.....:
|
||
Out[158]:
|
||
2011 2012 2013
|
||
1 -1.039268 -0.968914 2.565646
|
||
2 -0.370647 -1.294524 1.431256
|
||
3 -1.157892 0.413738 1.340309
|
||
4 -1.344312 0.276662 -1.170299
|
||
5 0.844885 -0.472035 -0.226169
|
||
6 1.075770 -0.013960 0.410835
|
||
7 -0.109050 -0.362543 0.813850
|
||
8 1.643563 -0.006154 0.132003
|
||
9 -1.469388 -0.923061 -0.827317
|
||
10 0.357021 0.895717 -0.076467
|
||
11 -0.674600 0.805244 -1.187678
|
||
12 -1.776904 -1.206412 1.130127
|
||
```
|
||
|
||
### Apply 函数
|
||
|
||
[把嵌入列表转换为多层索引 DataFrame](http://stackoverflow.com/questions/17349981/converting-pandas-dataframe-with-categorical-values-into-binary-values)
|
||
|
||
```python
|
||
In [159]: df = pd.DataFrame(data={'A': [[2, 4, 8, 16], [100, 200], [10, 20, 30]],
|
||
.....: 'B': [['a', 'b', 'c'], ['jj', 'kk'], ['ccc']]},
|
||
.....: index=['I', 'II', 'III'])
|
||
.....:
|
||
|
||
In [160]: def SeriesFromSubList(aList):
|
||
.....: return pd.Series(aList)
|
||
.....:
|
||
|
||
In [161]: df_orgz = pd.concat({ind: row.apply(SeriesFromSubList)
|
||
.....: for ind, row in df.iterrows()})
|
||
.....:
|
||
|
||
In [162]: df_orgz
|
||
Out[162]:
|
||
0 1 2 3
|
||
I A 2 4 8 16.0
|
||
B a b c NaN
|
||
II A 100 200 NaN NaN
|
||
B jj kk NaN NaN
|
||
III A 10 20 30 NaN
|
||
B ccc NaN NaN NaN
|
||
```
|
||
|
||
[返回 Series](http://stackoverflow.com/questions/19121854/using-rolling-apply-on-a-dataframe-object)
|
||
|
||
Rolling Apply to multiple columns where function calculates a Series before a Scalar from the Series is returned
|
||
|
||
```python
|
||
In [163]: df = pd.DataFrame(data=np.random.randn(2000, 2) / 10000,
|
||
.....: index=pd.date_range('2001-01-01', periods=2000),
|
||
.....: columns=['A', 'B'])
|
||
.....:
|
||
|
||
In [164]: df
|
||
Out[164]:
|
||
A B
|
||
2001-01-01 -0.000144 -0.000141
|
||
2001-01-02 0.000161 0.000102
|
||
2001-01-03 0.000057 0.000088
|
||
2001-01-04 -0.000221 0.000097
|
||
2001-01-05 -0.000201 -0.000041
|
||
... ... ...
|
||
2006-06-19 0.000040 -0.000235
|
||
2006-06-20 -0.000123 -0.000021
|
||
2006-06-21 -0.000113 0.000114
|
||
2006-06-22 0.000136 0.000109
|
||
2006-06-23 0.000027 0.000030
|
||
|
||
[2000 rows x 2 columns]
|
||
|
||
In [165]: def gm(df, const):
|
||
.....: v = ((((df.A + df.B) + 1).cumprod()) - 1) * const
|
||
.....: return v.iloc[-1]
|
||
.....:
|
||
|
||
In [166]: s = pd.Series({df.index[i]: gm(df.iloc[i:min(i + 51, len(df) - 1)], 5)
|
||
.....: for i in range(len(df) - 50)})
|
||
.....:
|
||
|
||
In [167]: s
|
||
Out[167]:
|
||
2001-01-01 0.000930
|
||
2001-01-02 0.002615
|
||
2001-01-03 0.001281
|
||
2001-01-04 0.001117
|
||
2001-01-05 0.002772
|
||
...
|
||
2006-04-30 0.003296
|
||
2006-05-01 0.002629
|
||
2006-05-02 0.002081
|
||
2006-05-03 0.004247
|
||
2006-05-04 0.003928
|
||
Length: 1950, dtype: float64
|
||
```
|
||
|
||
[返回标量值](http://stackoverflow.com/questions/21040766/python-pandas-rolling-apply-two-column-input-into-function/21045831#21045831)
|
||
|
||
Rolling Apply to multiple columns where function returns a Scalar (Volume Weighted Average Price)
|
||
对多列执行滚动 Apply,函数返回标量值(成交价加权平均价)
|
||
|
||
```python
|
||
In [168]: rng = pd.date_range(start='2014-01-01', periods=100)
|
||
|
||
In [169]: df = pd.DataFrame({'Open': np.random.randn(len(rng)),
|
||
.....: 'Close': np.random.randn(len(rng)),
|
||
.....: 'Volume': np.random.randint(100, 2000, len(rng))},
|
||
.....: index=rng)
|
||
.....:
|
||
|
||
In [170]: df
|
||
Out[170]:
|
||
Open Close Volume
|
||
2014-01-01 -1.611353 -0.492885 1219
|
||
2014-01-02 -3.000951 0.445794 1054
|
||
2014-01-03 -0.138359 -0.076081 1381
|
||
2014-01-04 0.301568 1.198259 1253
|
||
2014-01-05 0.276381 -0.669831 1728
|
||
... ... ... ...
|
||
2014-04-06 -0.040338 0.937843 1188
|
||
2014-04-07 0.359661 -0.285908 1864
|
||
2014-04-08 0.060978 1.714814 941
|
||
2014-04-09 1.759055 -0.455942 1065
|
||
2014-04-10 0.138185 -1.147008 1453
|
||
|
||
[100 rows x 3 columns]
|
||
|
||
In [171]: def vwap(bars):
|
||
.....: return ((bars.Close * bars.Volume).sum() / bars.Volume.sum())
|
||
.....:
|
||
|
||
In [172]: window = 5
|
||
|
||
In [173]: s = pd.concat([(pd.Series(vwap(df.iloc[i:i + window]),
|
||
.....: index=[df.index[i + window]]))
|
||
.....: for i in range(len(df) - window)])
|
||
.....:
|
||
|
||
In [174]: s.round(2)
|
||
Out[174]:
|
||
2014-01-06 0.02
|
||
2014-01-07 0.11
|
||
2014-01-08 0.10
|
||
2014-01-09 0.07
|
||
2014-01-10 -0.29
|
||
...
|
||
2014-04-06 -0.63
|
||
2014-04-07 -0.02
|
||
2014-04-08 -0.03
|
||
2014-04-09 0.34
|
||
2014-04-10 0.29
|
||
Length: 95, dtype: float64
|
||
```
|
||
|
||
## 时间序列
|
||
|
||
[删除指定时间之外的数据](http://stackoverflow.com/questions/14539992/pandas-drop-rows-outside-of-time-range)
|
||
|
||
[用 indexer 提取在时间范围内的数据](http://stackoverflow.com/questions/17559885/pandas-dataframe-mask-based-on-index)
|
||
|
||
[创建不包括周末,且只包含指定时间的日期时间范围](http://stackoverflow.com/questions/24010830/pandas-generate-sequential-timestamp-with-jump/24014440#24014440?)
|
||
|
||
[矢量查询](http://stackoverflow.com/questions/13893227/vectorized-look-up-of-values-in-pandas-dataframe)
|
||
|
||
[聚合与绘制时间序列](http://nipunbatra.github.io/2015/06/timeseries/)
|
||
|
||
把以小时为列,天为行的矩阵转换为连续的时间序列。 [如何重排 DataFrame?](http://stackoverflow.com/questions/15432659/how-to-rearrange-a-python-pandas-dataframe)
|
||
|
||
[重建索引为指定频率时,如何处理重复值](http://stackoverflow.com/questions/22244383/pandas-df-refill-adding-two-columns-of-different-shape)
|
||
|
||
为 DatetimeIndex 里每条记录计算当月第一天
|
||
|
||
```python
|
||
In [175]: dates = pd.date_range('2000-01-01', periods=5)
|
||
|
||
In [176]: dates.to_period(freq='M').to_timestamp()
|
||
Out[176]:
|
||
DatetimeIndex(['2000-01-01', '2000-01-01', '2000-01-01', '2000-01-01',
|
||
'2000-01-01'],
|
||
dtype='datetime64[ns]', freq=None)
|
||
```
|
||
|
||
|
||
|
||
### 重采样
|
||
|
||
[重采样](https://pandas.pydata.org/pandas-docs/stable/user_guide/timeseries.html#timeseries-resampling) 文档。
|
||
|
||
[用 Grouper 代替 TimeGrouper 处理时间分组的值 ](https://stackoverflow.com/questions/15297053/how-can-i-divide-single-values-of-a-dataframe-by-monthly-averages)
|
||
|
||
[含缺失值的时间分组](https://stackoverflow.com/questions/33637312/pandas-grouper-by-frequency-with-completeness-requirement)
|
||
|
||
[Grouper 的有效时间频率参数](http://pandas.pydata.org/pandas-docs/stable/timeseries.html#offset-aliases)
|
||
|
||
[用多层索引分组](https://stackoverflow.com/questions/41483763/pandas-timegrouper-on-multiindex)
|
||
|
||
[用 TimeGrouper 与另一个分组创建子分组,再 Apply 自定义函数](https://github.com/pandas-dev/pandas/issues/3791)
|
||
|
||
[按自定义时间段重采样](http://stackoverflow.com/questions/15408156/resampling-with-custom-periods)
|
||
|
||
[不添加新日期,重采样某日数据](http://stackoverflow.com/questions/14898574/resample-intrday-pandas-dataframe-without-add-new-days)
|
||
|
||
[按分钟重采样数据](http://stackoverflow.com/questions/14861023/resampling-minute-data)
|
||
|
||
[分组重采样](http://stackoverflow.com/q/18677271/564538)
|
||
|
||
|
||
## 合并
|
||
|
||
[连接](https://pandas.pydata.org/pandas-docs/stable/user_guide/merging.html#merging-concatenation) docs. The [Join](https://pandas.pydata.org/pandas-docs/stable/user_guide/merging.html#merging-join)文档。
|
||
|
||
[模拟 R 的 rbind:追加两个重叠索引的 DataFrame](http://stackoverflow.com/questions/14988480/pandas-version-of-rbind)
|
||
|
||
```python
|
||
In [177]: rng = pd.date_range('2000-01-01', periods=6)
|
||
|
||
In [178]: df1 = pd.DataFrame(np.random.randn(6, 3), index=rng, columns=['A', 'B', 'C'])
|
||
|
||
In [179]: df2 = df1.copy()
|
||
```
|
||
|
||
基于 df 构建器,需要`ignore_index`。
|
||
|
||
```python
|
||
In [180]: df = df1.append(df2, ignore_index=True)
|
||
|
||
In [181]: df
|
||
Out[181]:
|
||
A B C
|
||
0 -0.870117 -0.479265 -0.790855
|
||
1 0.144817 1.726395 -0.464535
|
||
2 -0.821906 1.597605 0.187307
|
||
3 -0.128342 -1.511638 -0.289858
|
||
4 0.399194 -1.430030 -0.639760
|
||
5 1.115116 -2.012600 1.810662
|
||
6 -0.870117 -0.479265 -0.790855
|
||
7 0.144817 1.726395 -0.464535
|
||
8 -0.821906 1.597605 0.187307
|
||
9 -0.128342 -1.511638 -0.289858
|
||
10 0.399194 -1.430030 -0.639760
|
||
11 1.115116 -2.012600 1.810662
|
||
```
|
||
|
||
[自连接 DataFrame](https://github.com/pandas-dev/pandas/issues/2996)
|
||
|
||
```python
|
||
In [182]: df = pd.DataFrame(data={'Area': ['A'] * 5 + ['C'] * 2,
|
||
.....: 'Bins': [110] * 2 + [160] * 3 + [40] * 2,
|
||
.....: 'Test_0': [0, 1, 0, 1, 2, 0, 1],
|
||
.....: 'Data': np.random.randn(7)})
|
||
.....:
|
||
|
||
In [183]: df
|
||
Out[183]:
|
||
Area Bins Test_0 Data
|
||
0 A 110 0 -0.433937
|
||
1 A 110 1 -0.160552
|
||
2 A 160 0 0.744434
|
||
3 A 160 1 1.754213
|
||
4 A 160 2 0.000850
|
||
5 C 40 0 0.342243
|
||
6 C 40 1 1.070599
|
||
|
||
In [184]: df['Test_1'] = df['Test_0'] - 1
|
||
|
||
In [185]: pd.merge(df, df, left_on=['Bins', 'Area', 'Test_0'],
|
||
.....: right_on=['Bins', 'Area', 'Test_1'],
|
||
.....: suffixes=('_L', '_R'))
|
||
.....:
|
||
Out[185]:
|
||
Area Bins Test_0_L Data_L Test_1_L Test_0_R Data_R Test_1_R
|
||
0 A 110 0 -0.433937 -1 1 -0.160552 0
|
||
1 A 160 0 0.744434 -1 1 1.754213 0
|
||
2 A 160 1 1.754213 0 2 0.000850 1
|
||
3 C 40 0 0.342243 -1 1 1.070599 0
|
||
```
|
||
|
||
[如何设置索引与连接](http://stackoverflow.com/questions/14341805/pandas-merge-pd-merge-how-to-set-the-index-and-join)
|
||
|
||
[KDB 式的 asof 连接](http://stackoverflow.com/questions/12322289/kdb-like-asof-join-for-timeseries-data-in-pandas/12336039#12336039)
|
||
|
||
[基于符合条件的值进行连接](http://stackoverflow.com/questions/15581829/how-to-perform-an-inner-or-outer-join-of-dataframes-with-pandas-on-non-simplisti)
|
||
|
||
[基于范围里的值,用 searchsorted 合并](http://stackoverflow.com/questions/25125626/pandas-merge-with-logic/2512764)
|
||
|
||
|
||
|
||
## 可视化
|
||
[可视化](https://pandas.pydata.org/pandas-docs/stable/user_guide/visualization.html#visualization) 文档。
|
||
|
||
[让 Matplotlib 看上去像 R](http://stackoverflow.com/questions/14349055/making-matplotlib-graphs-look-like-r-by-default)
|
||
|
||
[设置 x 轴的主次标签](http://stackoverflow.com/questions/12945971/pandas-timeseries-plot-setting-x-axis-major-and-minor-ticks-and-labels)
|
||
|
||
[在 iPython Notebook 里创建多个可视图](http://stackoverflow.com/questions/16392921/make-more-than-one-chart-in-same-ipython-notebook-cell)
|
||
|
||
[创建多行可视图](http://stackoverflow.com/questions/16568964/make-a-multiline-plot-from-csv-file-in-matplotlib)
|
||
|
||
[绘制热力图](http://stackoverflow.com/questions/17050202/plot-timeseries-of-histograms-in-python)
|
||
|
||
[标记时间序列图](http://stackoverflow.com/questions/11067368/annotate-time-series-plot-in-matplotlib)
|
||
|
||
[标记时间序列图 #2](http://stackoverflow.com/questions/17891493/annotating-points-from-a-pandas-dataframe-in-matplotlib-plot)
|
||
|
||
[用 Pandas、Vincent、xlsxwriter 生成 Excel 文件里的嵌入可视图](https://pandas-xlsxwriter-charts.readthedocs.io/)
|
||
|
||
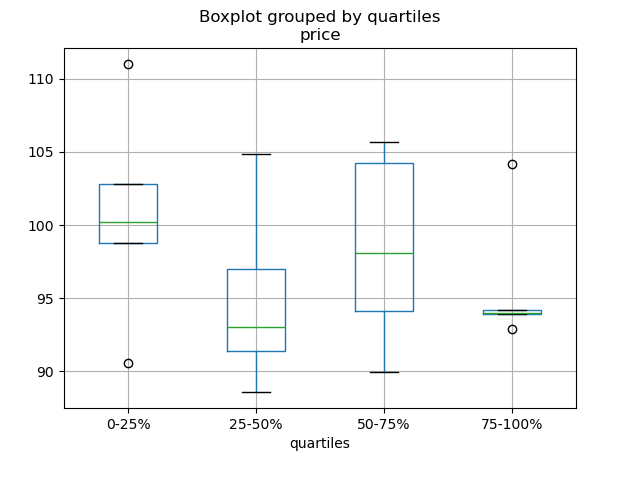
[为分层变量的每个四分位数绘制箱型图](http://stackoverflow.com/questions/23232989/boxplot-stratified-by-column-in-python-pandas)
|
||
|
||
```python
|
||
In [186]: df = pd.DataFrame(
|
||
.....: {'stratifying_var': np.random.uniform(0, 100, 20),
|
||
.....: 'price': np.random.normal(100, 5, 20)})
|
||
.....:
|
||
|
||
In [187]: df['quartiles'] = pd.qcut(
|
||
.....: df['stratifying_var'],
|
||
.....: 4,
|
||
.....: labels=['0-25%', '25-50%', '50-75%', '75-100%'])
|
||
.....:
|
||
|
||
In [188]: df.boxplot(column='price', by='quartiles')
|
||
Out[188]: <matplotlib.axes._subplots.AxesSubplot at 0x7efff077f910>
|
||
```
|
||
|
||
|
||
|
||
## 数据输入输出
|
||
|
||
[SQL 与 HDF5 性能对比](http://stackoverflow.com/questions/16628329/hdf5-and-sqlite-concurrency-compression-i-o-performance)
|
||
|
||
|
||
### CSV
|
||
|
||
[CSV](https://pandas.pydata.org/pandas-docs/stable/user_guide/io.html#io-read-csv-table)文档
|
||
|
||
[read_csv 函数实战](http://wesmckinney.com/blog/update-on-upcoming-pandas-v0-10-new-file-parser-other-performance-wins/)
|
||
|
||
[把 DataFrame 追加到 CSV 文件](http://stackoverflow.com/questions/17134942/pandas-dataframe-output-end-of-csv)
|
||
|
||
[分块读取 CSV](http://stackoverflow.com/questions/11622652/large-persistent-dataframe-in-pandas/12193309#12193309)
|
||
|
||
[分块读取指定的行](http://stackoverflow.com/questions/19674212/pandas-data-frame-select-rows-and-clear-memory)
|
||
|
||
[只读取 DataFrame 的前几列](http://stackoverflow.com/questions/15008970/way-to-read-first-few-lines-for-pandas-dataframe)
|
||
|
||
读取不是 `gzip 或 bz2` 压缩(read_csv 可识别的内置压缩格式)的文件。本例在介绍如何读取 `WinZip` 压缩文件的同时,还介绍了在环境管理器里打开文件,并读取内容的通用操作方式。[详见本链接](http://stackoverflow.com/questions/17789907/pandas-convert-winzipped-csv-file-to-data-frame)
|
||
|
||
[推断文件数据类型](http://stackoverflow.com/questions/15555005/get-inferred-dataframe-types-iteratively-using-chunksize)
|
||
|
||
[处理出错数据](http://github.com/pandas-dev/pandas/issues/2886)
|
||
|
||
[处理出错数据 II](http://nipunbatra.github.io/2013/06/reading-unclean-data-csv-using-pandas/)
|
||
|
||
[用 Unix 时间戳读取 CSV,并转为本地时区](http://nipunbatra.github.io/2013/06/pandas-reading-csv-with-unix-timestamps-and-converting-to-local-timezone/)
|
||
|
||
[写入多行索引 CSV 时,不写入重复值](http://stackoverflow.com/questions/17349574/pandas-write-multiindex-rows-with-to-csv)
|
||
|
||
|
||
#### 从多个文件读取数据,创建单个 DataFrame
|
||
|
||
最好的方式是先一个个读取单个文件,然后再把每个文件的内容存成列表,再用 `pd.concat()` 组合成一个 DataFrame:
|
||
|
||
```python
|
||
In [189]: for i in range(3):
|
||
.....: data = pd.DataFrame(np.random.randn(10, 4))
|
||
.....: data.to_csv('file_{}.csv'.format(i))
|
||
.....:
|
||
|
||
In [190]: files = ['file_0.csv', 'file_1.csv', 'file_2.csv']
|
||
|
||
In [191]: result = pd.concat([pd.read_csv(f) for f in files], ignore_index=True)
|
||
```
|
||
|
||
还可以用同样的方法读取所有匹配同一模式的文件,下面这个例子使用的是`glob`:
|
||
|
||
```python
|
||
In [192]: import glob
|
||
|
||
In [193]: import os
|
||
|
||
In [194]: files = glob.glob('file_*.csv')
|
||
|
||
In [195]: result = pd.concat([pd.read_csv(f) for f in files], ignore_index=True)
|
||
```
|
||
|
||
最后,这种方式也适用于 [io 文档](https://pandas.pydata.org/pandas-docs/stable/user_guide/io.html#io) 介绍的其它 `pd.read_*` 函数。
|
||
|
||
#### 解析多列里的日期组件
|
||
|
||
用一种格式解析多列的日期组件,速度更快。
|
||
|
||
```python
|
||
In [196]: i = pd.date_range('20000101', periods=10000)
|
||
|
||
In [197]: df = pd.DataFrame({'year': i.year, 'month': i.month, 'day': i.day})
|
||
|
||
In [198]: df.head()
|
||
Out[198]:
|
||
year month day
|
||
0 2000 1 1
|
||
1 2000 1 2
|
||
2 2000 1 3
|
||
3 2000 1 4
|
||
4 2000 1 5
|
||
|
||
In [199]: %timeit pd.to_datetime(df.year * 10000 + df.month * 100 + df.day, format='%Y%m%d')
|
||
.....: ds = df.apply(lambda x: "%04d%02d%02d" % (x['year'],
|
||
.....: x['month'], x['day']), axis=1)
|
||
.....: ds.head()
|
||
.....: %timeit pd.to_datetime(ds)
|
||
.....:
|
||
10.6 ms +- 698 us per loop (mean +- std. dev. of 7 runs, 100 loops each)
|
||
3.21 ms +- 36.4 us per loop (mean +- std. dev. of 7 runs, 100 loops each)
|
||
```
|
||
|
||
#### 跳过标题与数据之间的行
|
||
|
||
```python
|
||
In [200]: data = """;;;;
|
||
.....: ;;;;
|
||
.....: ;;;;
|
||
.....: ;;;;
|
||
.....: ;;;;
|
||
.....: ;;;;
|
||
.....: ;;;;
|
||
.....: ;;;;
|
||
.....: ;;;;
|
||
.....: ;;;;
|
||
.....: date;Param1;Param2;Param4;Param5
|
||
.....: ;m²;°C;m²;m
|
||
.....: ;;;;
|
||
.....: 01.01.1990 00:00;1;1;2;3
|
||
.....: 01.01.1990 01:00;5;3;4;5
|
||
.....: 01.01.1990 02:00;9;5;6;7
|
||
.....: 01.01.1990 03:00;13;7;8;9
|
||
.....: 01.01.1990 04:00;17;9;10;11
|
||
.....: 01.01.1990 05:00;21;11;12;13
|
||
.....: """
|
||
.....:
|
||
```
|
||
|
||
##### 选项 1:显式跳过行
|
||
|
||
```python
|
||
In [201]: from io import StringIO
|
||
|
||
In [202]: pd.read_csv(StringIO(data), sep=';', skiprows=[11, 12],
|
||
.....: index_col=0, parse_dates=True, header=10)
|
||
.....:
|
||
Out[202]:
|
||
Param1 Param2 Param4 Param5
|
||
date
|
||
1990-01-01 00:00:00 1 1 2 3
|
||
1990-01-01 01:00:00 5 3 4 5
|
||
1990-01-01 02:00:00 9 5 6 7
|
||
1990-01-01 03:00:00 13 7 8 9
|
||
1990-01-01 04:00:00 17 9 10 11
|
||
1990-01-01 05:00:00 21 11 12 13
|
||
```
|
||
|
||
##### 选项 2:读取列名,然后再读取数据
|
||
|
||
```python
|
||
In [203]: pd.read_csv(StringIO(data), sep=';', header=10, nrows=10).columns
|
||
Out[203]: Index(['date', 'Param1', 'Param2', 'Param4', 'Param5'], dtype='object')
|
||
|
||
In [204]: columns = pd.read_csv(StringIO(data), sep=';', header=10, nrows=10).columns
|
||
|
||
In [205]: pd.read_csv(StringIO(data), sep=';', index_col=0,
|
||
.....: header=12, parse_dates=True, names=columns)
|
||
.....:
|
||
Out[205]:
|
||
Param1 Param2 Param4 Param5
|
||
date
|
||
1990-01-01 00:00:00 1 1 2 3
|
||
1990-01-01 01:00:00 5 3 4 5
|
||
1990-01-01 02:00:00 9 5 6 7
|
||
1990-01-01 03:00:00 13 7 8 9
|
||
1990-01-01 04:00:00 17 9 10 11
|
||
1990-01-01 05:00:00 21 11 12 13
|
||
```
|
||
|
||
### SQL
|
||
|
||
[SQL](https://pandas.pydata.org/pandas-docs/stable/user_guide/io.html#io-sql) 文档
|
||
|
||
[用 SQL 读取数据库](http://stackoverflow.com/questions/10065051/python-pandas-and-databases-like-mysql)
|
||
|
||
### Excel
|
||
|
||
[Excel](https://pandas.pydata.org/pandas-docs/stable/user_guide/io.html#io-excel) 文档
|
||
|
||
[读取文件式句柄](http://stackoverflow.com/questions/15588713/sheets-of-excel-workbook-from-a-url-into-a-pandas-dataframe)
|
||
|
||
[用 XlsxWriter 修改输出格式](http://pbpython.com/improve-pandas-excel-output.html)
|
||
|
||
### HTML
|
||
|
||
[从不能处理默认请求 header 的服务器读取 HTML 表格](http://stackoverflow.com/a/18939272/564538)
|
||
|
||
### HDFStore
|
||
|
||
[HDFStores](https://pandas.pydata.org/pandas-docs/stable/user_guide/io.html#io-hdf5)文档
|
||
|
||
[时间戳索引简单查询](http://stackoverflow.com/questions/13926089/selecting-columns-from-pandas-hdfstore-table)
|
||
|
||
[用链式多表架构管理异构数据](http://github.com/pandas-dev/pandas/issues/3032)
|
||
|
||
[在硬盘上合并数百万行的表格](http://stackoverflow.com/questions/14614512/merging-two-tables-with-millions-of-rows-in-python/14617925#14617925)
|
||
|
||
[避免多进程/线程存储数据出现不一致](http://stackoverflow.com/a/29014295/2858145)
|
||
|
||
按块对大规模数据存储去重的本质是递归还原操作。[这里](http://stackoverflow.com/questions/16110252/need-to-compare-very-large-files-around-1-5gb-in-python/16110391#16110391)介绍了一个函数,可以从 CSV 文件里按块提取数据,解析日期后,再按块存储。
|
||
|
||
[按块读取 CSV 文件,并保存](http://stackoverflow.com/questions/20428355/appending-column-to-frame-of-hdf-file-in-pandas/20428786#20428786)
|
||
|
||
[追加到已存储的文件,且确保索引唯一](http://stackoverflow.com/questions/16997048/how-does-one-append-large-amounts-of-data-to-a-pandas-hdfstore-and-get-a-natural/16999397#16999397)
|
||
|
||
[大规模数据工作流](http://stackoverflow.com/questions/14262433/large-data-work-flows-using-pandas)
|
||
|
||
[读取一系列文件,追加时采用全局唯一索引](http://stackoverflow.com/questions/16997048/how-does-one-append-large-amounts-of-data-to-a-pandas-hdfstore-and-get-a-natural)
|
||
|
||
[用低分组密度分组 HDFStore 文件](http://stackoverflow.com/questions/15798209/pandas-group-by-query-on-large-data-in-hdfstore)
|
||
|
||
[用高分组密度分组 HDFStore 文件](http://stackoverflow.com/questions/25459982/trouble-with-grouby-on-millions-of-keys-on-a-chunked-file-in-python-pandas/25471765#25471765)
|
||
|
||
[HDFStore 文件结构化查询](http://stackoverflow.com/questions/22777284/improve-query-performance-from-a-large-hdfstore-table-with-pandas/22820780#22820780)
|
||
|
||
[HDFStore 计数](http://stackoverflow.com/questions/20497897/converting-dict-of-dicts-into-pandas-dataframe-memory-issues)
|
||
|
||
[HDFStore 异常解答](http://stackoverflow.com/questions/15488809/how-to-trouble-shoot-hdfstore-exception-cannot-find-the-correct-atom-type)
|
||
|
||
[用字符串设置 min_itemsize](http://stackoverflow.com/questions/15988871/hdfstore-appendstring-dataframe-fails-when-string-column-contents-are-longer)
|
||
|
||
[用 ptrepack 创建完全排序索引](http://stackoverflow.com/questions/17893370/ptrepack-sortby-needs-full-index)
|
||
|
||
把属性存至分组节点
|
||
|
||
```python
|
||
In [206]: df = pd.DataFrame(np.random.randn(8, 3))
|
||
|
||
In [207]: store = pd.HDFStore('test.h5')
|
||
|
||
In [208]: store.put('df', df)
|
||
|
||
# 用 pickle 存储任意 Python 对象
|
||
In [209]: store.get_storer('df').attrs.my_attribute = {'A': 10}
|
||
|
||
In [210]: store.get_storer('df').attrs.my_attribute
|
||
Out[210]: {'A': 10}
|
||
```
|
||
|
||
|
||
|
||
### 二进制文件
|
||
|
||
读取 C 结构体数组组成的二进制文件,Pandas 支持 NumPy 记录数组。 比如说,名为 `main.c` 的文件包含下列 C 代码,并在 64 位机器上用 `gcc main.c -std=gnu99` 进行编译。
|
||
|
||
```python
|
||
#include <stdio.h>
|
||
#include <stdint.h>
|
||
|
||
typedef struct _Data
|
||
{
|
||
int32_t count;
|
||
double avg;
|
||
float scale;
|
||
} Data;
|
||
|
||
int main(int argc, const char *argv[])
|
||
{
|
||
size_t n = 10;
|
||
Data d[n];
|
||
|
||
for (int i = 0; i < n; ++i)
|
||
{
|
||
d[i].count = i;
|
||
d[i].avg = i + 1.0;
|
||
d[i].scale = (float) i + 2.0f;
|
||
}
|
||
|
||
FILE *file = fopen("binary.dat", "wb");
|
||
fwrite(&d, sizeof(Data), n, file);
|
||
fclose(file);
|
||
|
||
return 0;
|
||
}
|
||
```
|
||
|
||
下列 Python 代码读取二进制二建 `binary.dat`,并将之存为 pandas `DataFrame`,每个结构体的元素对应 DataFrame 里的列:
|
||
|
||
```python
|
||
names = 'count', 'avg', 'scale'
|
||
|
||
# 注意:因为结构体填充,位移量比类型尺寸大
|
||
offsets = 0, 8, 16
|
||
formats = 'i4', 'f8', 'f4'
|
||
dt = np.dtype({'names': names, 'offsets': offsets, 'formats': formats},
|
||
align=True)
|
||
df = pd.DataFrame(np.fromfile('binary.dat', dt))
|
||
```
|
||
|
||
::: tip 注意
|
||
|
||
不同机器上创建的文件因其架构不同,结构化元素的位移量也不同,原生二进制格式文件不能跨平台使用,因此不建议作为通用数据存储格式。建议用 Pandas IO 功能支持的 HDF5 或 msgpack 文件。
|
||
|
||
:::
|
||
|
||
|
||
## 计算
|
||
|
||
[基于采样的时间序列数值整合](http://nbviewer.ipython.org/5720498)
|
||
|
||
### 相关性
|
||
|
||
用 [`DataFrame.corr()`](https://pandas.pydata.org/pandas-docs/stable/reference/api/pandas.DataFrame.corr.html#pandas.DataFrame.corr) 计算得出的相关矩阵的下(或上)三角形式一般都非常有用。下例通过把布尔掩码传递给 `where` 可以实现这一功能:
|
||
|
||
```python
|
||
In [211]: df = pd.DataFrame(np.random.random(size=(100, 5)))
|
||
|
||
In [212]: corr_mat = df.corr()
|
||
|
||
In [213]: mask = np.tril(np.ones_like(corr_mat, dtype=np.bool), k=-1)
|
||
|
||
In [214]: corr_mat.where(mask)
|
||
Out[214]:
|
||
0 1 2 3 4
|
||
0 NaN NaN NaN NaN NaN
|
||
1 -0.018923 NaN NaN NaN NaN
|
||
2 -0.076296 -0.012464 NaN NaN NaN
|
||
3 -0.169941 -0.289416 0.076462 NaN NaN
|
||
4 0.064326 0.018759 -0.084140 -0.079859 NaN
|
||
```
|
||
|
||
除了命名相关类型之外,`DataFrame.corr` 还接受回调,此处计算 DataFrame 对象的[距离相关矩阵](https://en.wikipedia.org/wiki/Distance_correlation)。
|
||
|
||
```python
|
||
In [215]: def distcorr(x, y):
|
||
.....: n = len(x)
|
||
.....: a = np.zeros(shape=(n, n))
|
||
.....: b = np.zeros(shape=(n, n))
|
||
.....: for i in range(n):
|
||
.....: for j in range(i + 1, n):
|
||
.....: a[i, j] = abs(x[i] - x[j])
|
||
.....: b[i, j] = abs(y[i] - y[j])
|
||
.....: a += a.T
|
||
.....: b += b.T
|
||
.....: a_bar = np.vstack([np.nanmean(a, axis=0)] * n)
|
||
.....: b_bar = np.vstack([np.nanmean(b, axis=0)] * n)
|
||
.....: A = a - a_bar - a_bar.T + np.full(shape=(n, n), fill_value=a_bar.mean())
|
||
.....: B = b - b_bar - b_bar.T + np.full(shape=(n, n), fill_value=b_bar.mean())
|
||
.....: cov_ab = np.sqrt(np.nansum(A * B)) / n
|
||
.....: std_a = np.sqrt(np.sqrt(np.nansum(A**2)) / n)
|
||
.....: std_b = np.sqrt(np.sqrt(np.nansum(B**2)) / n)
|
||
.....: return cov_ab / std_a / std_b
|
||
.....:
|
||
|
||
In [216]: df = pd.DataFrame(np.random.normal(size=(100, 3)))
|
||
|
||
In [217]: df.corr(method=distcorr)
|
||
Out[217]:
|
||
0 1 2
|
||
0 1.000000 0.199653 0.214871
|
||
1 0.199653 1.000000 0.195116
|
||
2 0.214871 0.195116 1.000000
|
||
```
|
||
|
||
## 时间差
|
||
|
||
[时间差](https://pandas.pydata.org/pandas-docs/stable/user_guide/timedeltas.html#timedeltas-timedeltas)文档。
|
||
|
||
[使用时间差](http://github.com/pandas-dev/pandas/pull/2899)
|
||
|
||
```python
|
||
In [218]: import datetime
|
||
|
||
In [219]: s = pd.Series(pd.date_range('2012-1-1', periods=3, freq='D'))
|
||
|
||
In [220]: s - s.max()
|
||
Out[220]:
|
||
0 -2 days
|
||
1 -1 days
|
||
2 0 days
|
||
dtype: timedelta64[ns]
|
||
|
||
In [221]: s.max() - s
|
||
Out[221]:
|
||
0 2 days
|
||
1 1 days
|
||
2 0 days
|
||
dtype: timedelta64[ns]
|
||
|
||
In [222]: s - datetime.datetime(2011, 1, 1, 3, 5)
|
||
Out[222]:
|
||
0 364 days 20:55:00
|
||
1 365 days 20:55:00
|
||
2 366 days 20:55:00
|
||
dtype: timedelta64[ns]
|
||
|
||
In [223]: s + datetime.timedelta(minutes=5)
|
||
Out[223]:
|
||
0 2012-01-01 00:05:00
|
||
1 2012-01-02 00:05:00
|
||
2 2012-01-03 00:05:00
|
||
dtype: datetime64[ns]
|
||
|
||
In [224]: datetime.datetime(2011, 1, 1, 3, 5) - s
|
||
Out[224]:
|
||
0 -365 days +03:05:00
|
||
1 -366 days +03:05:00
|
||
2 -367 days +03:05:00
|
||
dtype: timedelta64[ns]
|
||
|
||
In [225]: datetime.timedelta(minutes=5) + s
|
||
Out[225]:
|
||
0 2012-01-01 00:05:00
|
||
1 2012-01-02 00:05:00
|
||
2 2012-01-03 00:05:00
|
||
dtype: datetime64[ns]
|
||
```
|
||
|
||
[日期加减](http://stackoverflow.com/questions/16385785/add-days-to-dates-in-dataframe)
|
||
|
||
```python
|
||
In [226]: deltas = pd.Series([datetime.timedelta(days=i) for i in range(3)])
|
||
|
||
In [227]: df = pd.DataFrame({'A': s, 'B': deltas})
|
||
|
||
In [228]: df
|
||
Out[228]:
|
||
A B
|
||
0 2012-01-01 0 days
|
||
1 2012-01-02 1 days
|
||
2 2012-01-03 2 days
|
||
|
||
In [229]: df['New Dates'] = df['A'] + df['B']
|
||
|
||
In [230]: df['Delta'] = df['A'] - df['New Dates']
|
||
|
||
In [231]: df
|
||
Out[231]:
|
||
A B New Dates Delta
|
||
0 2012-01-01 0 days 2012-01-01 0 days
|
||
1 2012-01-02 1 days 2012-01-03 -1 days
|
||
2 2012-01-03 2 days 2012-01-05 -2 days
|
||
|
||
In [232]: df.dtypes
|
||
Out[232]:
|
||
A datetime64[ns]
|
||
B timedelta64[ns]
|
||
New Dates datetime64[ns]
|
||
Delta timedelta64[ns]
|
||
dtype: object
|
||
```
|
||
|
||
[其它示例](http://stackoverflow.com/questions/15683588/iterating-through-a-pandas-dataframe)
|
||
|
||
与 datetime 类似,用 `np.nan` 可以把值设为 `NaT`。
|
||
|
||
```python
|
||
In [233]: y = s - s.shift()
|
||
|
||
In [234]: y
|
||
Out[234]:
|
||
0 NaT
|
||
1 1 days
|
||
2 1 days
|
||
dtype: timedelta64[ns]
|
||
|
||
In [235]: y[1] = np.nan
|
||
|
||
In [236]: y
|
||
Out[236]:
|
||
0 NaT
|
||
1 NaT
|
||
2 1 days
|
||
dtype: timedelta64[ns]
|
||
```
|
||
|
||
## 轴别名
|
||
|
||
设置全局轴别名,可以定义以下两个函数:
|
||
|
||
```python
|
||
In [237]: def set_axis_alias(cls, axis, alias):
|
||
.....: if axis not in cls._AXIS_NUMBERS:
|
||
.....: raise Exception("invalid axis [%s] for alias [%s]" % (axis, alias))
|
||
.....: cls._AXIS_ALIASES[alias] = axis
|
||
.....:
|
||
In [238]: def clear_axis_alias(cls, axis, alias):
|
||
.....: if axis not in cls._AXIS_NUMBERS:
|
||
.....: raise Exception("invalid axis [%s] for alias [%s]" % (axis, alias))
|
||
.....: cls._AXIS_ALIASES.pop(alias, None)
|
||
.....:
|
||
In [239]: set_axis_alias(pd.DataFrame, 'columns', 'myaxis2')
|
||
|
||
In [240]: df2 = pd.DataFrame(np.random.randn(3, 2), columns=['c1', 'c2'],
|
||
.....: index=['i1', 'i2', 'i3'])
|
||
.....:
|
||
|
||
In [241]: df2.sum(axis='myaxis2')
|
||
Out[241]:
|
||
i1 -0.461013
|
||
i2 2.040016
|
||
i3 0.904681
|
||
dtype: float64
|
||
|
||
In [242]: clear_axis_alias(pd.DataFrame, 'columns', 'myaxis2')
|
||
```
|
||
|
||
## 创建示例数据
|
||
|
||
类似 R 的 `expand.grid()` 函数,用不同类型的值组生成 DataFrame,需要创建键是列名,值是数据值列表的字典:
|
||
|
||
```python
|
||
In [243]: def expand_grid(data_dict):
|
||
.....: rows = itertools.product(*data_dict.values())
|
||
.....: return pd.DataFrame.from_records(rows, columns=data_dict.keys())
|
||
.....:
|
||
|
||
In [244]: df = expand_grid({'height': [60, 70],
|
||
.....: 'weight': [100, 140, 180],
|
||
.....: 'sex': ['Male', 'Female']})
|
||
.....:
|
||
|
||
In [245]: df
|
||
Out[245]:
|
||
height weight sex
|
||
0 60 100 Male
|
||
1 60 100 Female
|
||
2 60 140 Male
|
||
3 60 140 Female
|
||
4 60 180 Male
|
||
5 60 180 Female
|
||
6 70 100 Male
|
||
7 70 100 Female
|
||
8 70 140 Male
|
||
9 70 140 Female
|
||
10 70 180 Male
|
||
11 70 180 Female
|
||
``` |